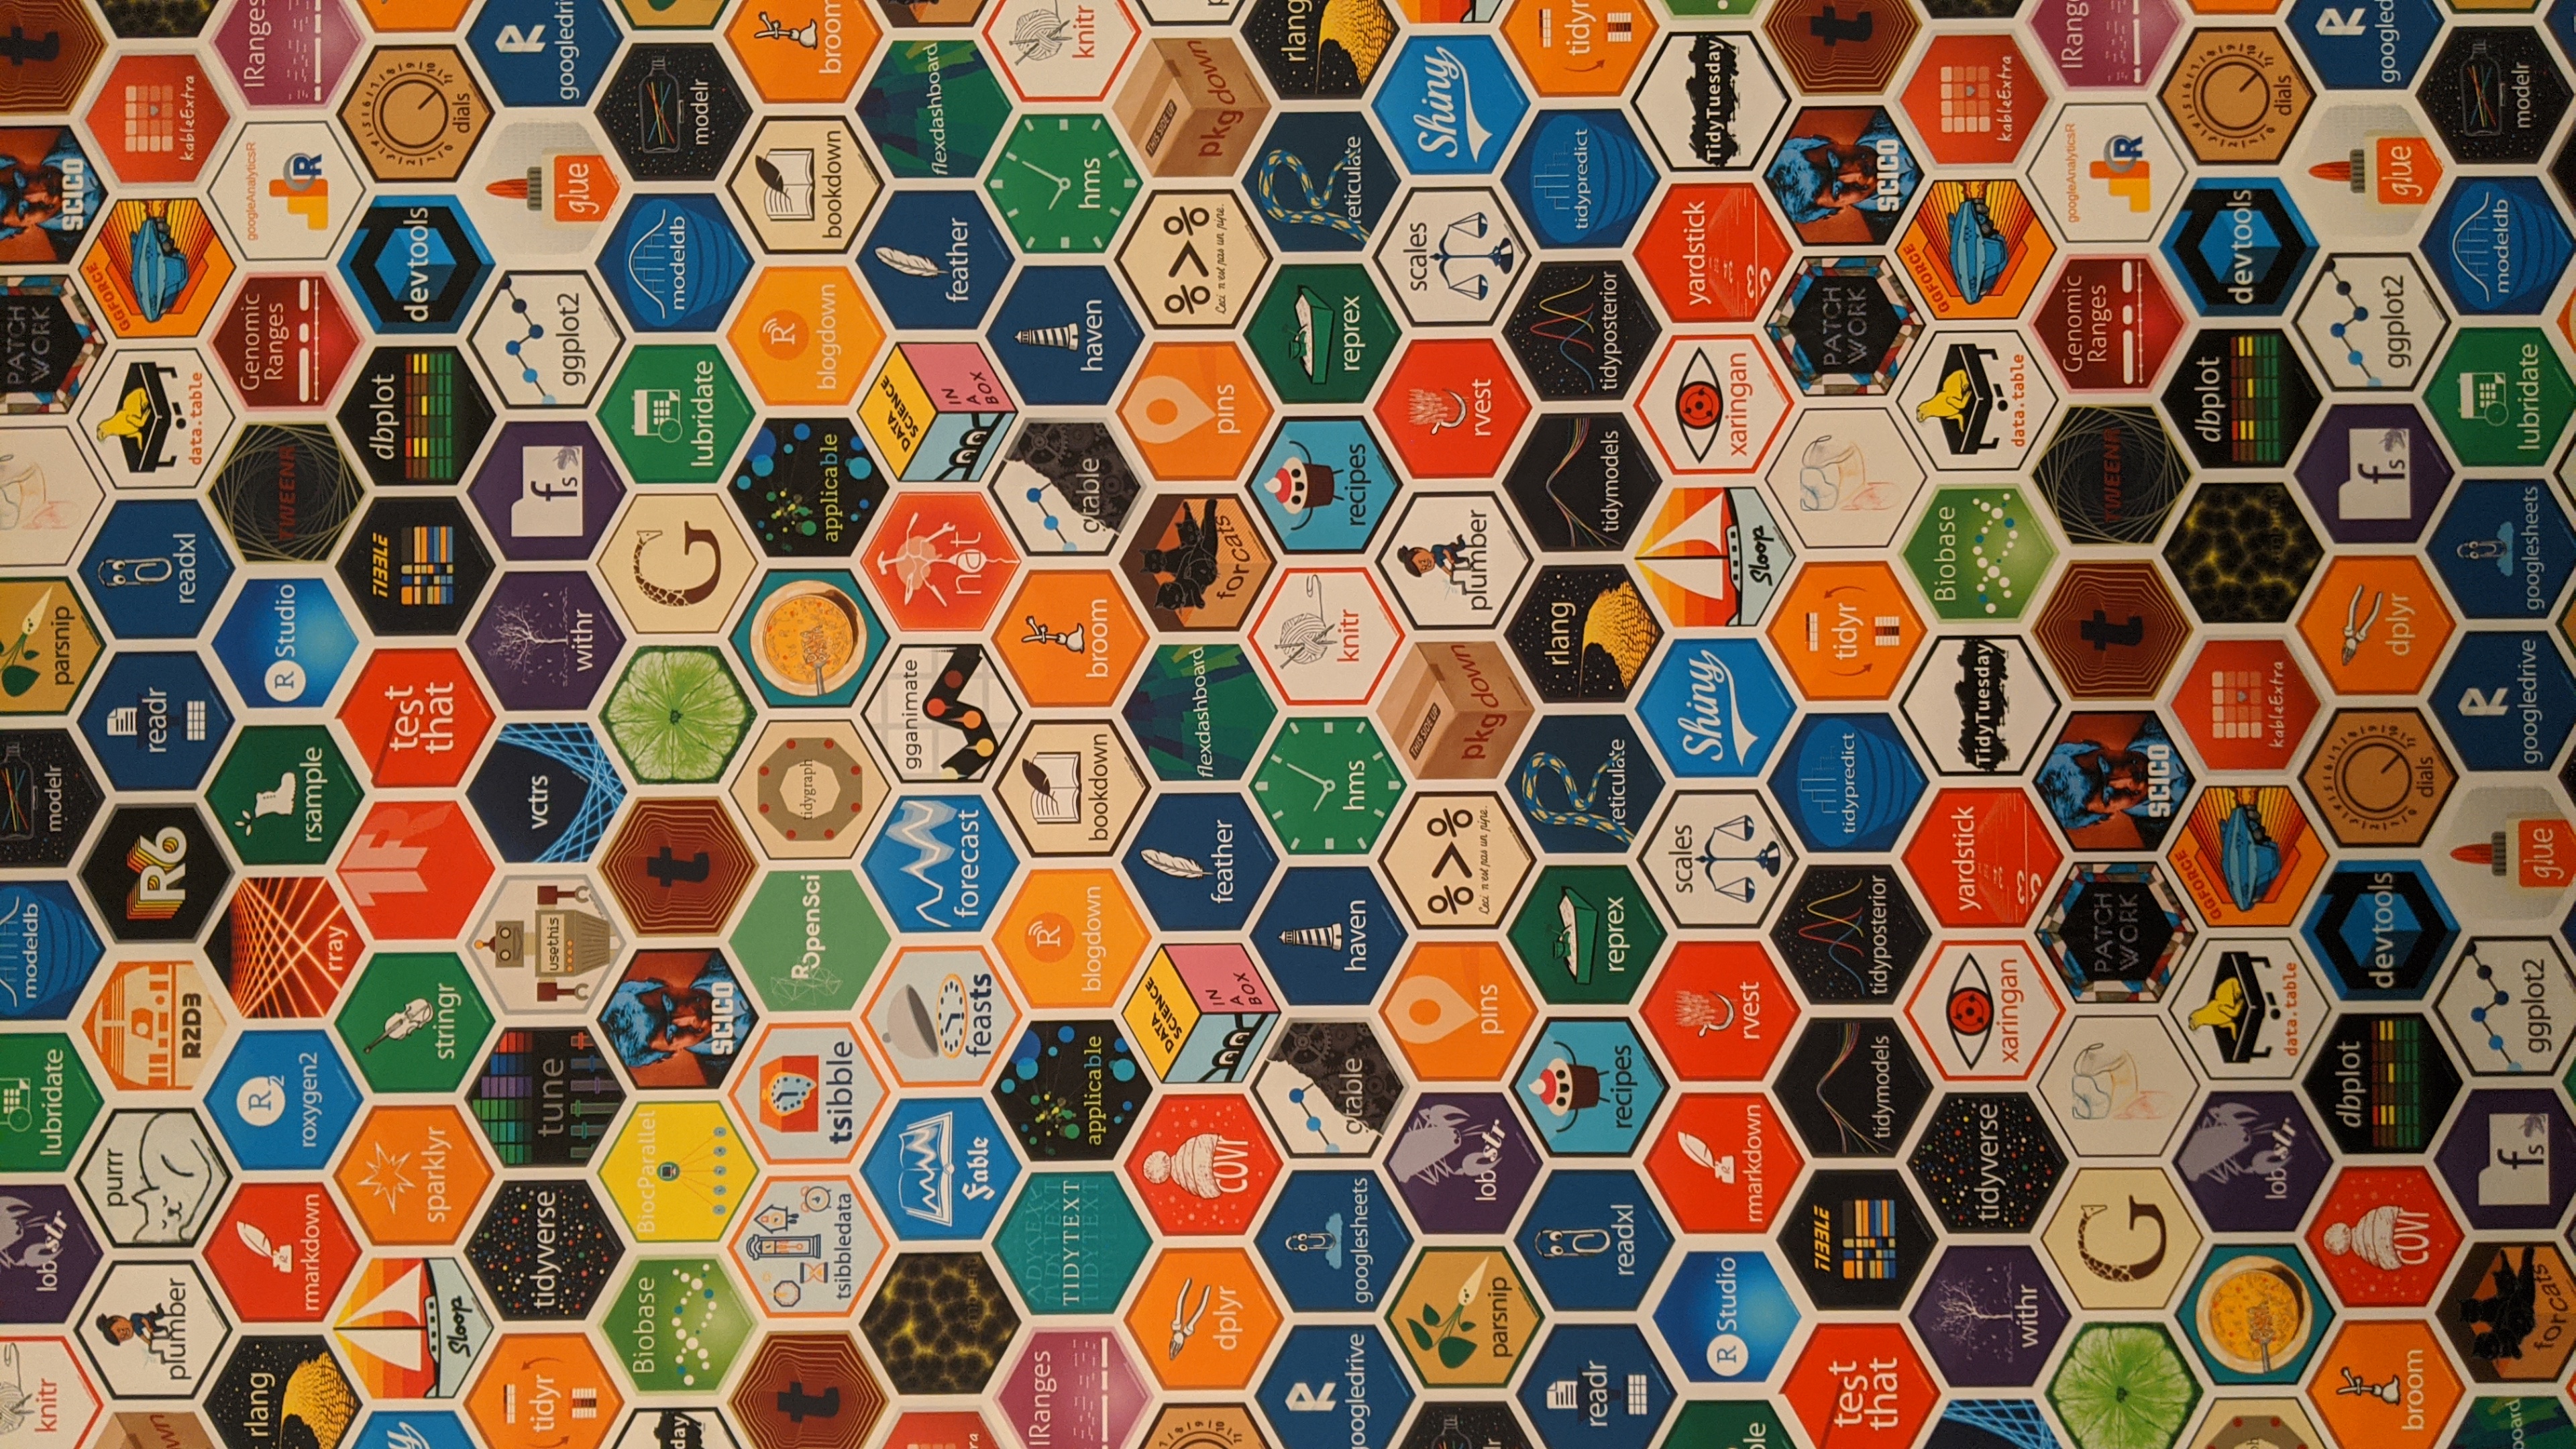
Ode to R, Happy 25th Birthday
As R turns 25 years old this year, I thought it would only be appropriate to thank the creators of R, Ross Ihaka and Robert Gentleman, as well as the R global community for changing my life. I started learning R in 2014 because I was tired at how SAS had become like a curmudgeon old monopoly rather than a true innovator. But I guess that is what happens to companies with a first mover advantage; they get complacent and feel invincible.
Freedom, yes freedom, that is what R gave me. The freedom to model, analyze, and visualize all types of data to include geographical, wih a lightweight program that is supported by thousands of R users and programmers. The freedom of not being dependent on one company for my own career success. It was hard to learn R, but anyone who fights for there freedom knows that it is worth the sacrifice. R really didn’t catch on with me until I started DataCamp. Within 6 months I dropped SAS and I have conducted all my statistical work in R ever since. My independence day was the summer of 2016; I have never looked back.
R is so amazing that I am writing this blog in R from my RStudio IDE. I created this website with the blogdown package, created by Yihui Xie, et al, at Rstudio. I learned about blogdown at the Rstudio 2018 conference at the end of January and had my blog built by the end of February. I have so long wanted to do this but I had never had the time to learn web development in html, and wordpress is so not reproducible. Thank you to both. In addition to websites, you can build just about anything from reproducible reports in Word, pdf, html slideshows, powerpoint, and Excel reports, to journals and books. I no longer deliver PowerPoint slides to my clients because they are time consuming and short lived. My favorite delivery method is html documents because, with R and Rnotebooks, I can deliver dynamic self-serving graphs and tables. When combinged with GitHub pages, you just deliverd results to your clients that are available on their laptop, phone, or tablet from where ever they need to be. No more fumbling through emails to pull up those results, just bookmark one link and results are available 24/7. Yes, this can be done on Enterprise GitHub as well.
To all of those who have thought about learning R, I highly recommend that you do whatever it takes to learn it. Not only SAS users, but SSPS users and especially MS Excel users. The beauty and ease of data visualizations with ggplot2 alone is worth never opening MS Excel ever again, not to mention that you can easily analyze data in the hundreds of millions of rows on your laptop. Those learning R today have an amazing advantage and that is that they can leverage all of tidyverse created and contributed by Hadley Wickham, et al. This means no longer learning the nuts and bolts of R to became efficient and create valuable content. With just dplyr and ggplot2 you can basically do everything that Excel can do, but better with more choices and control. Its like going from black and white silent films to seeing 3D movies. And finally, it is reproducible. You know what I am talking about if you’ve been given an Excel spreadsheet with several dozens tabs and asked to update it. Ridiculous, and a big waste of time.
So to all the R users out there lets say thank you to R and the R community by supporting Hadley Wickham’s celebration of 25 years of R by contributing to his cause here. Thank you R, all the members of Rstudio, DataCamp and the rest of the R community for changing my life; there no words to express my gratitude.
